Land-Mix Analysis Formula
![]()
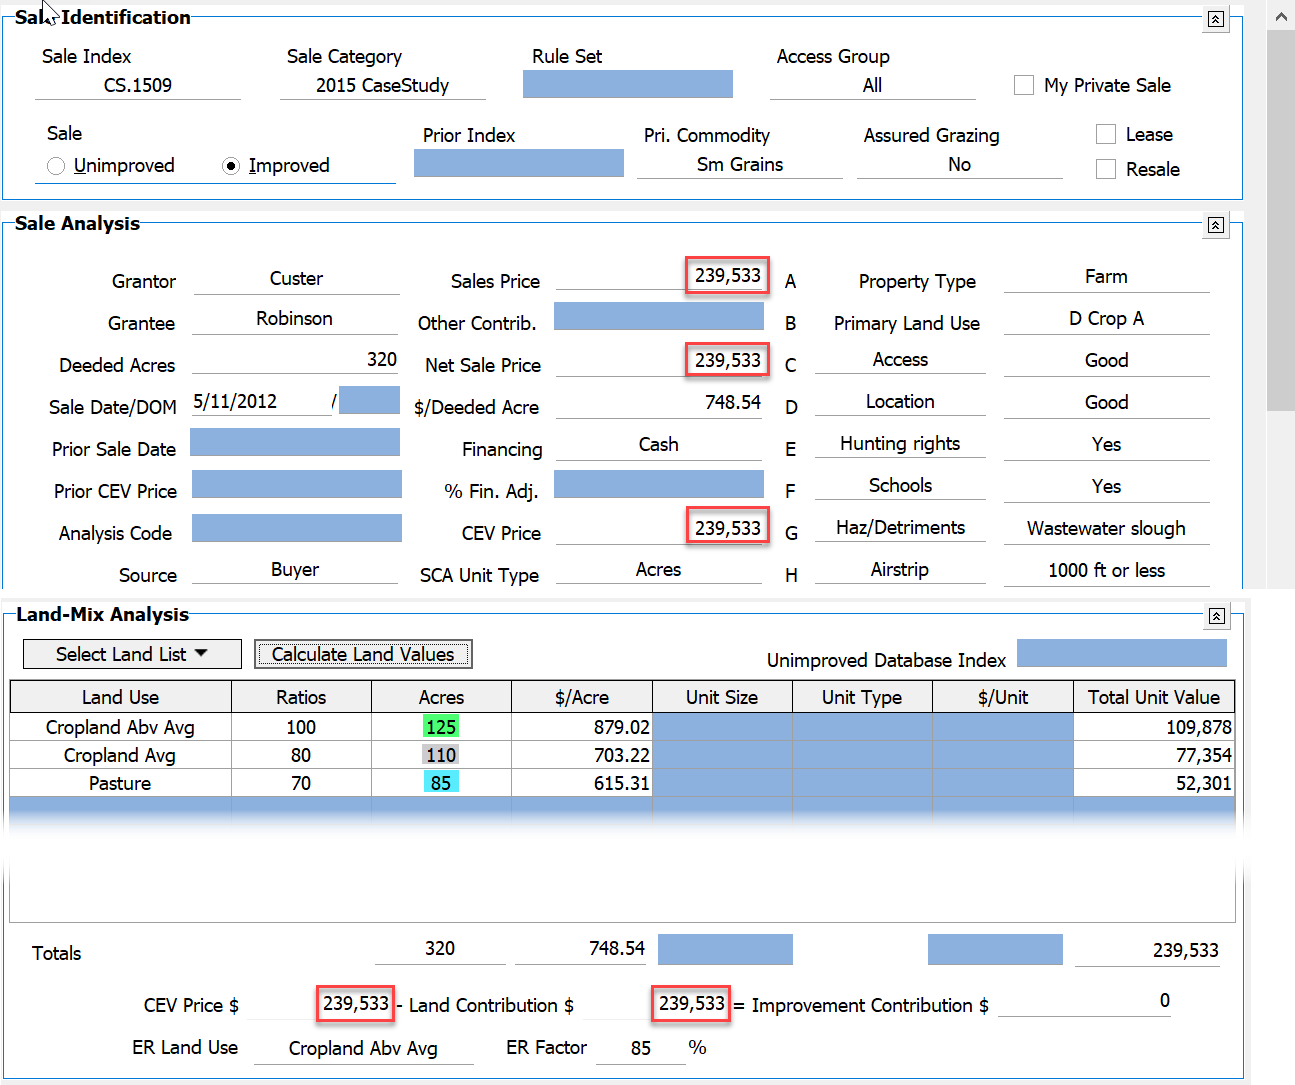
If interested in how DataLog calculates values for the Land-Mix Analysis, here is a simplified example of an unimproved sale, where the user input the land uses, their ratios, the number of acres for each use, and the CEV price (equal to the Sales Price here). Last, the user clicked the Calculate Land Values button and the #/Acre and Total Unit Value columns in the grid automatically populated with the numbers shown:
How does DataLog determine the $/Acre values for each of the land rows?
In the explanation below, X represents the unknown $/Acre value for the first row, the value that serves as the base from which the remaining values are derived. This is the reason the first row ratio must always be 100.
Given: The CEV Price is $4000; the ratios are 100, 120, and 70 for the land types; the acreages are 8, 5 and 8 respectively. Therefore:
125(100% x) + 110(80% x) + 85(70% x) = $239,533
125x + 110(0.8x) + 85(0.7x) = $293,533
125x + 88x + 59.5x = $293,533
272.5 = $293,533
x = $879.02 therefore 0.8x = $703.22 and 0.7x = $615.31
DataLog will also auto-calculate the average bare ground $/Acre value ($748.54 in the example) and show correctly that there is essentially zero remaining for an Improvement Contribution. The $1 difference is due to rounding and is not significant in terms of the analysis.