Sales Grid Footer
![]()
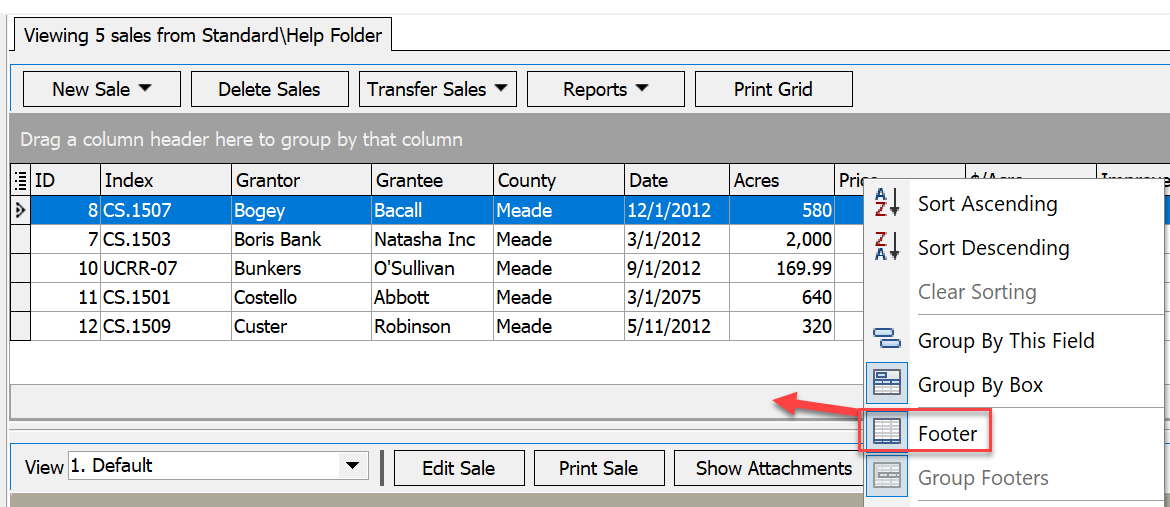
In the DataLog Sales Grid, there is an optional footer feature that will display additional statistics over the sales in the current folder. To enable the footer, right click on any of the column headers to display the grid right-click menu. When you click on the footer option in the right-click menu, you will see a gray bar appear below the sales grid.
Once the footer is visible, you can turn on the different statistic options by right clicking in the footer directly under the desired column. You can only turn on one statistic at a time per column. For example, to turn on the average dollar per acre for the sales currently shown in the sales grid, right click on the footer directly under the $/acre column and choose average. You will then see the average dollar per acre in the footer under that column. You can also choose to display the sum, minimum, maximum, or count.
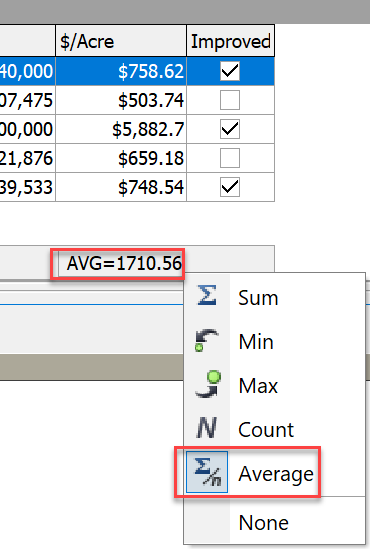
To remove the currently shown statistic from the sales grid, right click on the currently shown statistic and choose none.