Create & Transfer Composite Location Map
![]()
It is possible to create and copy a map of the subject and comparable sales to the clipboard in DataLog and paste the map into an exhibit page in ClickForms, or into a Word document. Printing a map is also an option.
In order for a map to transfer into a report with a sale, it must be embedded into the sale in a DataLog Photo Page.
Method #1
To create a sales location map similar to the one shown below…
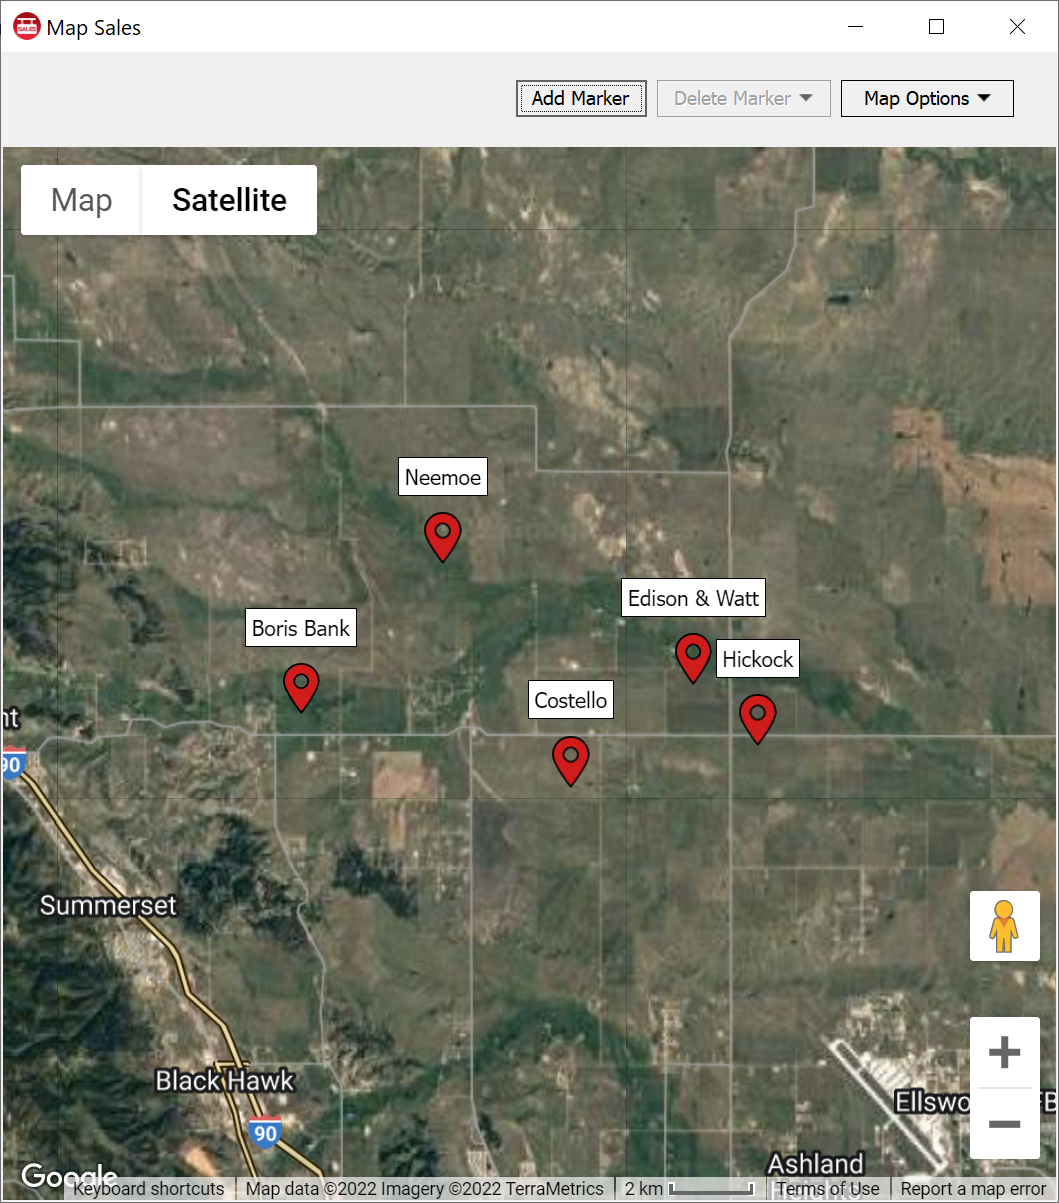
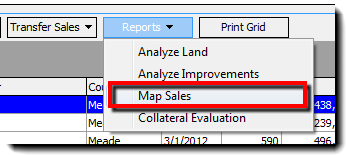
…click Map Sales under Reports in DataLog.
The software will map all geo-coded sales in the active folder, so if you need to be selective , place a copy of only the desired sales in their own folder before choosing Map Sales from the Reports drop-down menu.
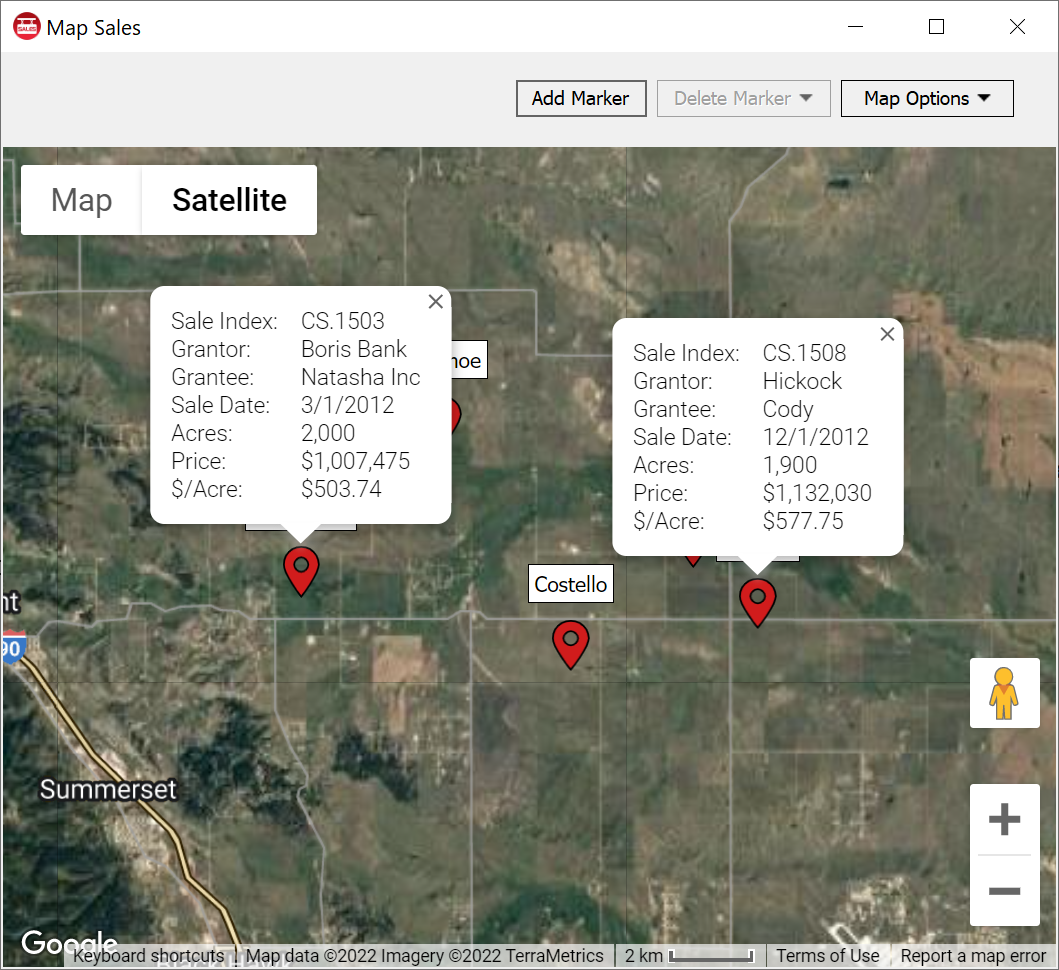
If desired, the composite map can display call-outs; choose this clicking on the black dot on the marker pin.
Call-outs cannot be formatted, re-sized, or re-positioned at this time.
Tip: If for some reason you want to attach the composite map to a specific sale, or include it in a photo page in DataLog (because photo pages will transfer into ClickFORMS with the sale), copy it to the clipboard and then paste it into a DataLog photo page associated with the desired sale.
Method #2
In the View drop-down list is a Map Sales option.
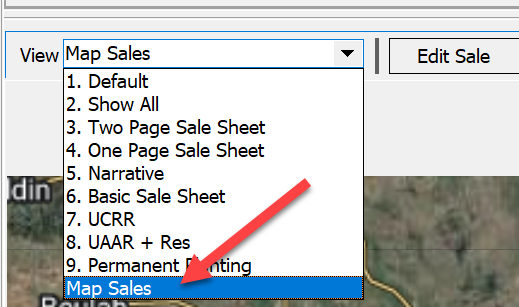
When this option is chosen, the software will display the sales in the folder that are geo-coded with the added benefit of a checklist. Notice the Selected column in the sales grid that identifies which sales are included.
Check/uncheck sales as desired; the map display will update accordingly.
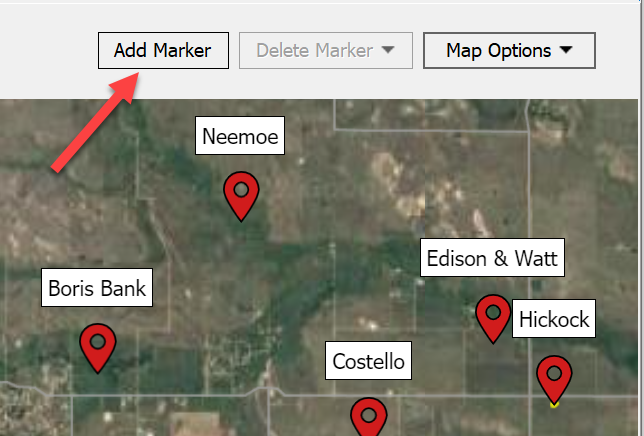
To add a marker for an approximate location, click the Add Marker button.
This feature is useful when a subject marker is desired.
A box will open so that a text label can be created for the marker.
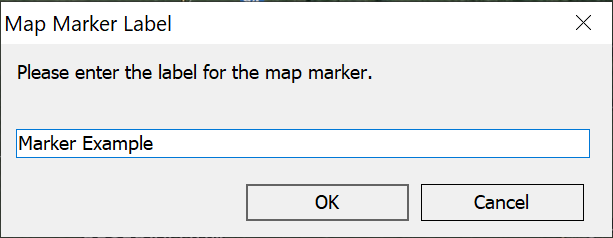
The marker can be dragged to the desired location.
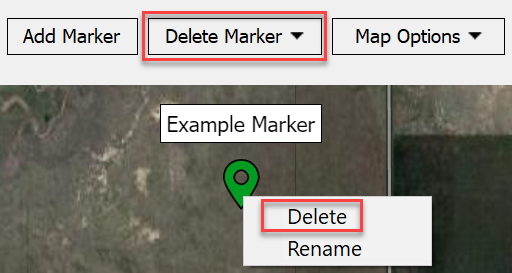
It can be deleted by clicking the Delete Marker button or right-clicking the pin and choosing Delete.