Mapping
![]()
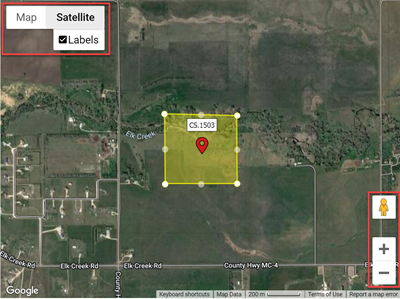
DataLog includes an integrated mapping feature. This is accessed while directly editing the sale in DataLog.
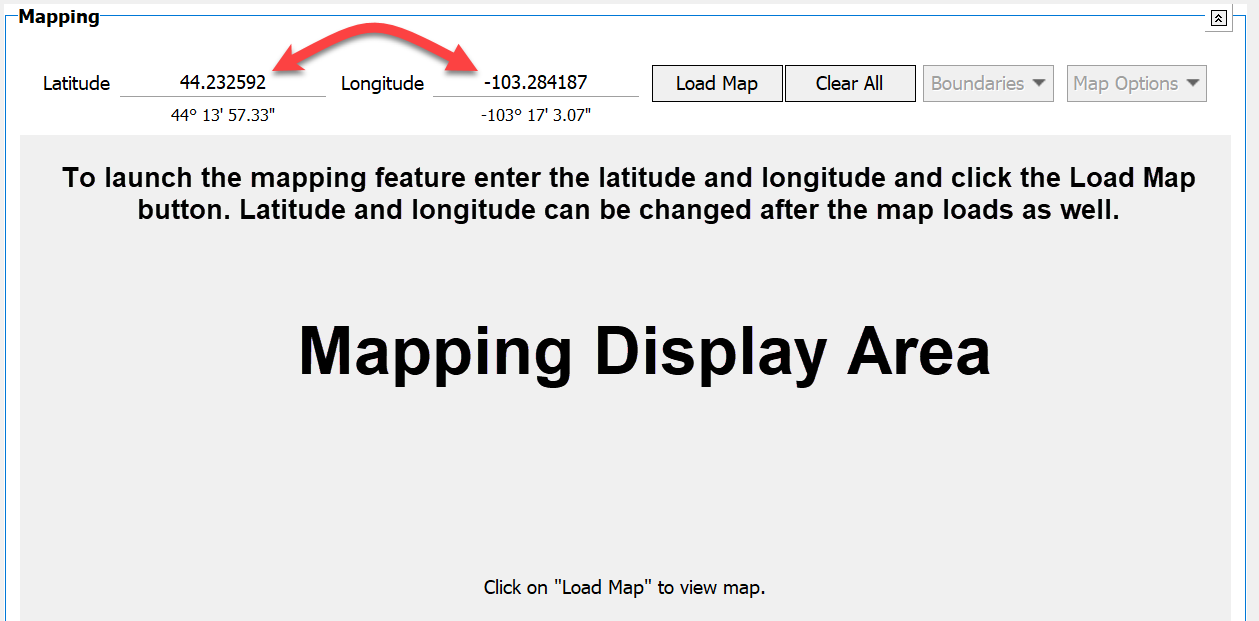
Use known latitude/longitude markers to localize a geographical point, or drop a marker onto a Google Map. To launch the feature, click the Load Map button, and a Google map of the continental United States will be displayed. Latitude and Longitude coordinates can be entered first if desired. The map will localize accordingly and display a marker.
|
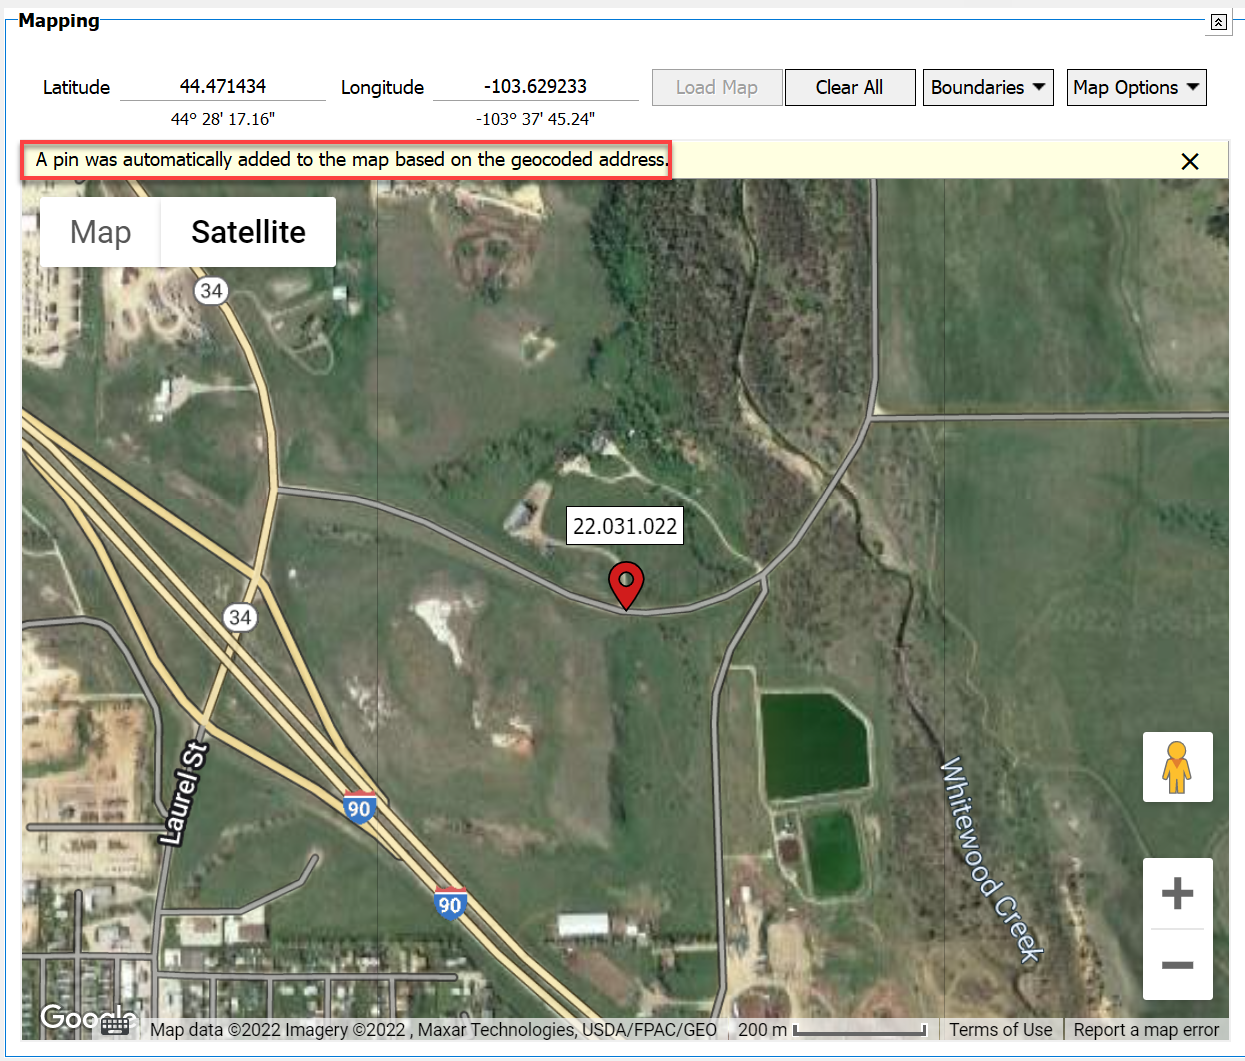
If there is a valid 911 address in the sale analysis section, the latitude and longitude will already be filled and a pin will automatically be dropped when the map is loaded.
|
|
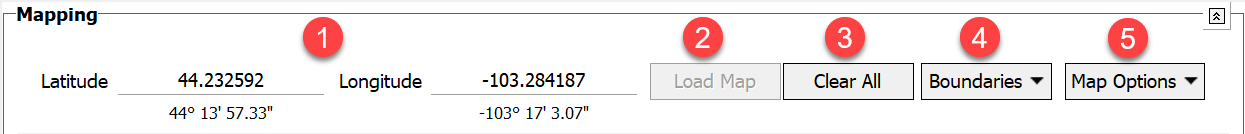
There a five sections in the mapping toolbar
|
1. Latitude/Logitude - enter the Latitude and Longitude coordinates in decimal format, including +/- as necessary.
|
2. Load Map - Loads the map into the mapping display area.
|
||
|
3. Add Marker/Clear All - If no marker is on the map the button will say add marker. Do this by clicking the button and then anywhere on the map to drop a pin (pins can be dragged after the pin is dropped). If there is a marker or boundary, the button will say Clear All. This removes all markers and boundaries from the map. |
|||
|
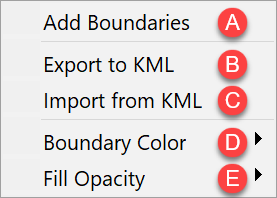
4. Boundaries - This button has 5 options |
|||
|
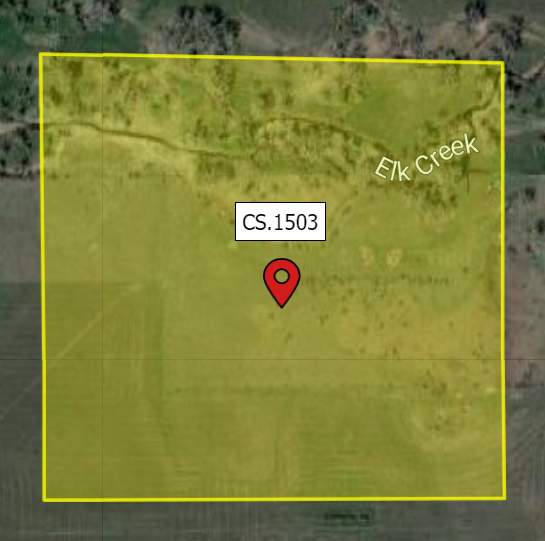
A. Add Boundaries - Adds boundaries.
|
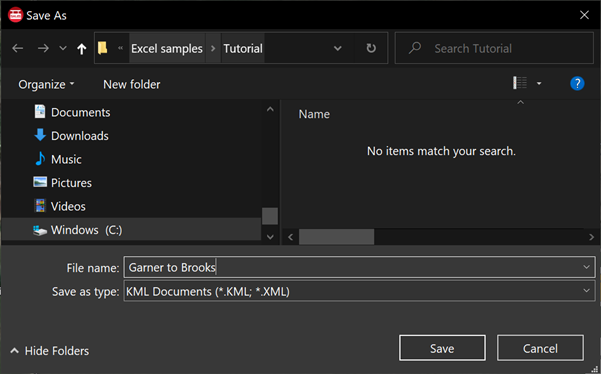
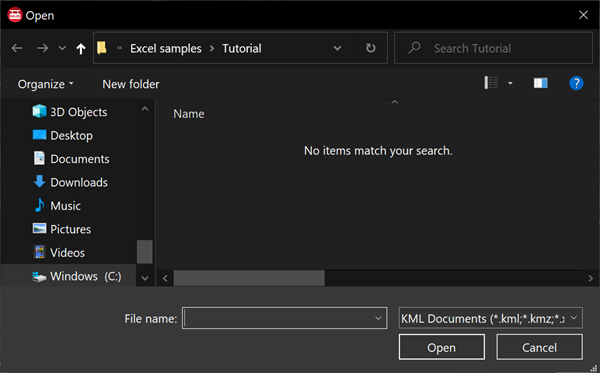
B. Export to KML - Opens a dialog for navigation where to save the KML. |
||
|
C. Import From KML - Opens a dialog for navigation to the KML to be imported. |
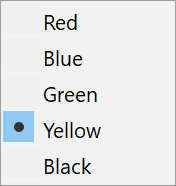
D. Boundary Color - Has 5 color options to choose from. |
||
|
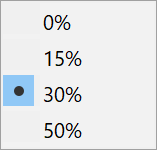
E. Opacity - has 4 opacity presets. |
|||
|
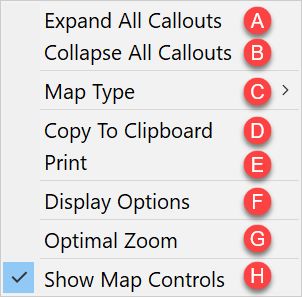
5. Map Options - Has 8 Items in the dropdown list
|
|||
|
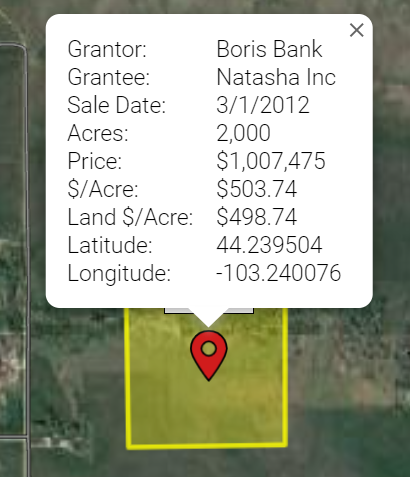
A. Expand All Callouts - Expands the callouts for more information on the sale. |
B. Colapse All Callouts - Colapses the callouts.
|
||
|
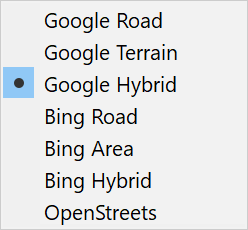
C. Map Type - Change the map displayed to 1 of 7 map types. |
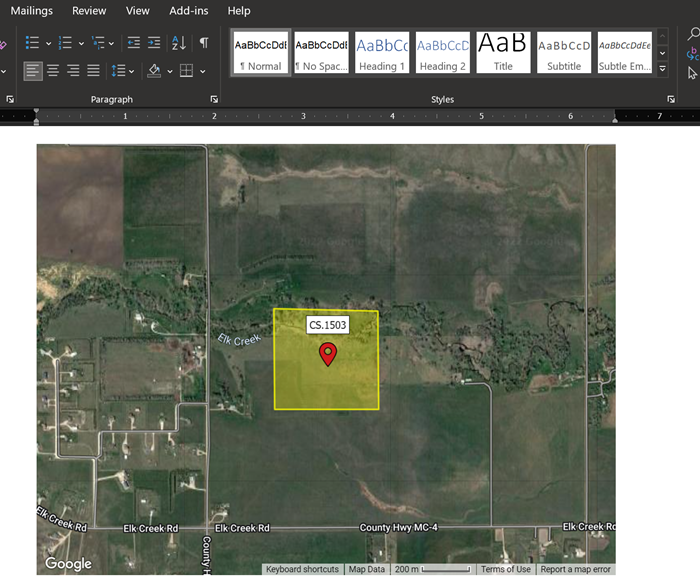
D. Copy To Clipboard - Copies the map as displayed. This map can then be pasted into an exhibit form in ClickForms or paste it into an email, word document, etc. |
||
|
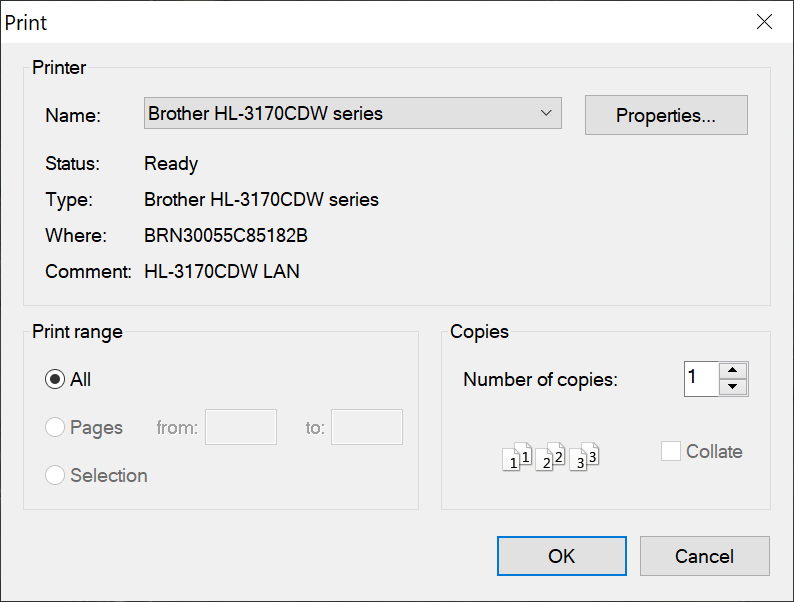
E. Print - Prints the map to a printer or to a PDF.
|
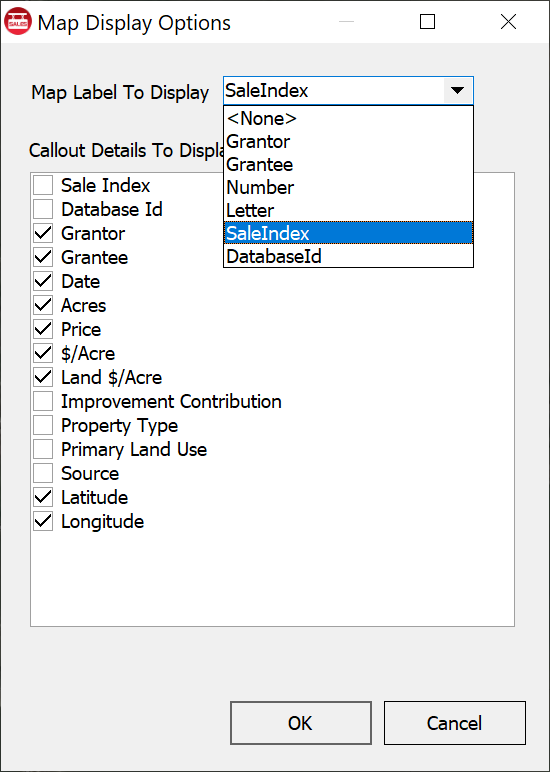
F. Display Options - Brings up a dialog box with display options. This is where what to display on your map label is set, and what details to display on the callouts.
|
||
|
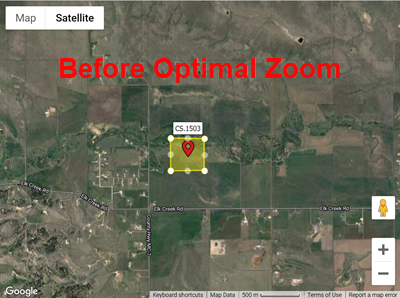
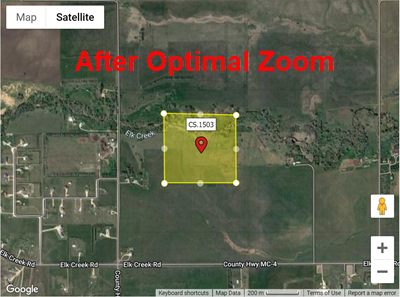
G. Optimal Zoom - Zooms to the optimal view. |
H. Show Map Controls - When unchecked, the map controls are no longer displayed. |
||
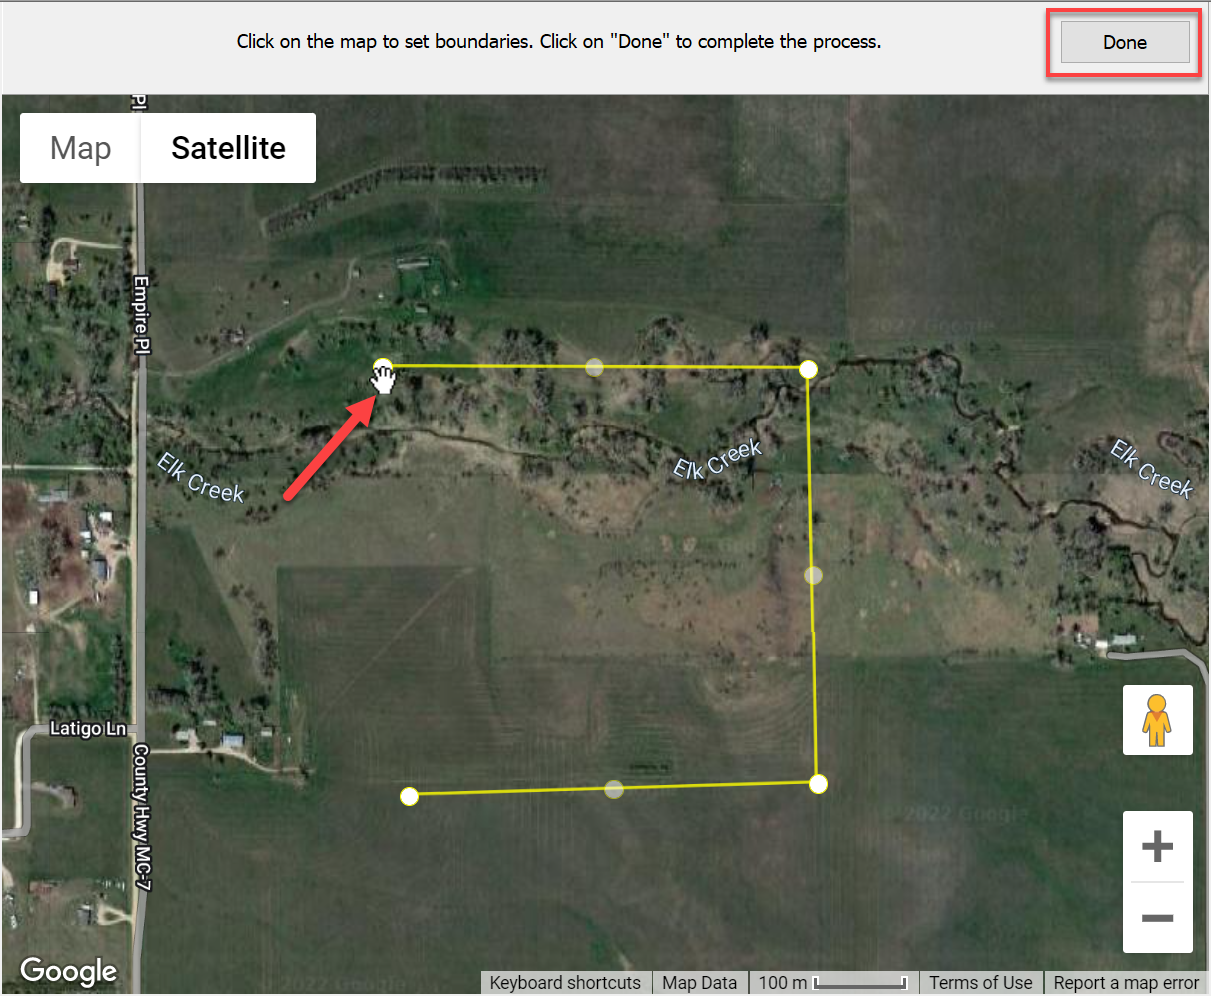
Boundaries have some features that allow for more granular settings.
Right Clicking a boundary give two options. Edit Property Coordinates (Polygon) and Delete Coordinates.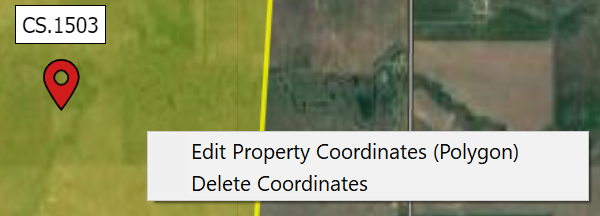
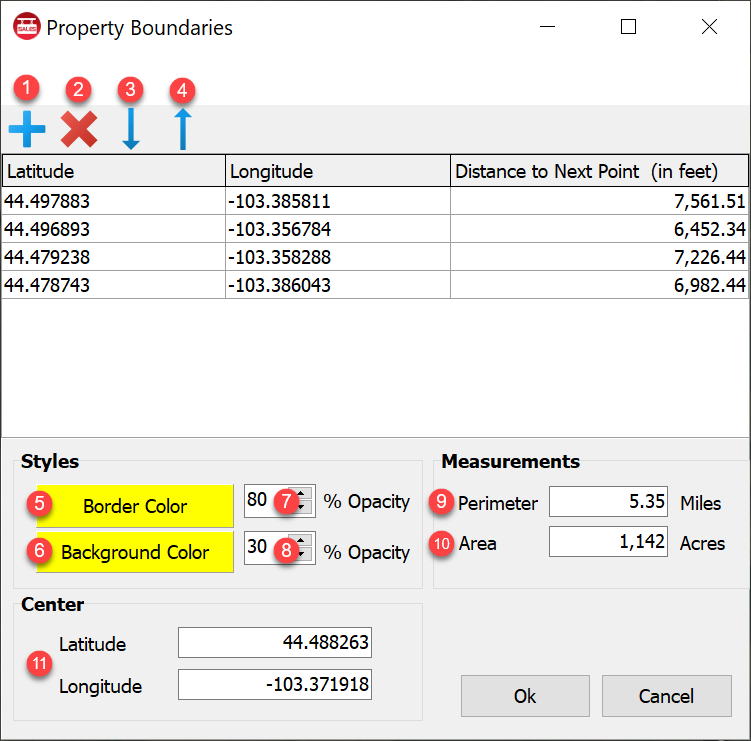
Editing the coordinates open a dialog that allows for even more control.
|
1. Adds a polygon point. |
2. Deletes the currently selected polygon point. |
3. Moves the currently selected polygon point down. |
|
4. Moves the currently selected polygon point up. |
5. Changes the border color. |
6. Changes the background color. |
|
7. Sets the border opacity. |
8. Sets the background opacity. |
9. Displays the perimeter in Miles |
|
10. Displays the area in Acres |
11. Displays the calculated center of the polygon's latitude and longitude. |
|
The map coordinates are stored when a sale is saved. Users must be connected to the Internet in order to view the sale map.
These maps will automatically transfer into a report with the sale using the Insert Sale Map feature in ClickForms.
AgWare has some integrated mapping features.
For more information on MapRight Integration, see the Land id Integration article in this documentation.
For more information on Surety Integration, see the Surety Maps article in this documentation.
Information about additional mapping services that are popular with AgWare customers:
One of the more popular options is Google Earth which is different from on-line Google Maps.
You can add pins and property boundaries and then save the current view as an image.
Here is a link on how to add a place marker in Google Earth:
http://support.google.com/earth/bin/answer.py?hl=en&answer=176683
The reason a lot of users like Google Earth is because you can add Section/Township/Range lines through a third party service:
http://www.earthpoint.us/
We also have some customers using services like Microsoft MapPoint, Delorme maps, Land Voyage, AgriData, and local tax property maps.