Entering a Sale
Sale Analysys
In the Sale Analysis area of the new sale, check Improved/Unimproved as appropriate. Tab through the cells to enter sale data such as grantor, grantee, acres, price, etc. When entering data into certain cells such as Sales Price, other cells populate automatically with data, i.e. CEV Price.
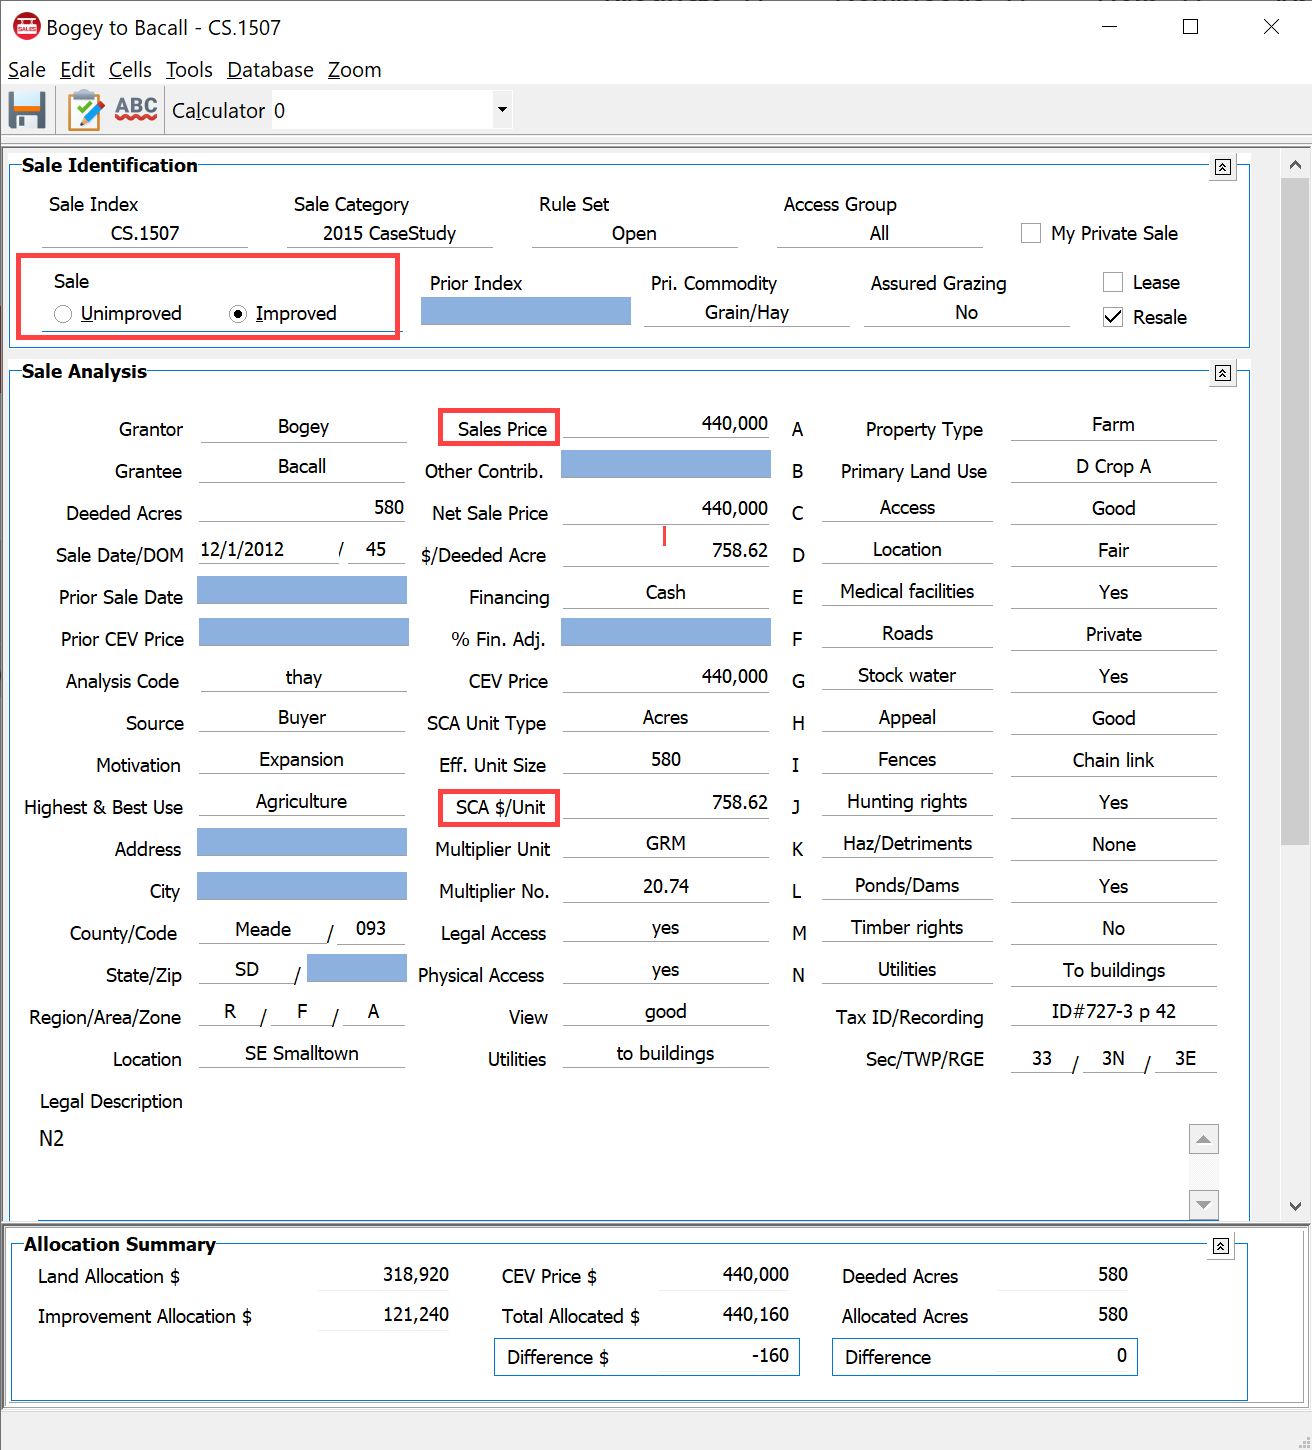
Be sure to enter Effective Unit Size and the SCA (Sales Comparison Analysis) Unit Type. This is frequently identified as acres; however, in cases where acres are NOT the proper unit comparison, others such as ER Units, AUMs, board feet, barrels, wet-acres, crop-acres, etc., may be used.
For most cells, a drop-down menu for saved responses can be created.
Note: When “mousing” over certain cells a padlock icon is seen. This indicates that the cell is “locked” by the software for automatic calculations. If the user elects to change a value for a locked cell, simply click the padlock and it will “open” and you can enter your specific change as an “over-ride”. Click again to change back to the default value. The “red” font color will remind you that you of the unlocked the cell and entered your own value. The red font does not show on printed sales or reports.

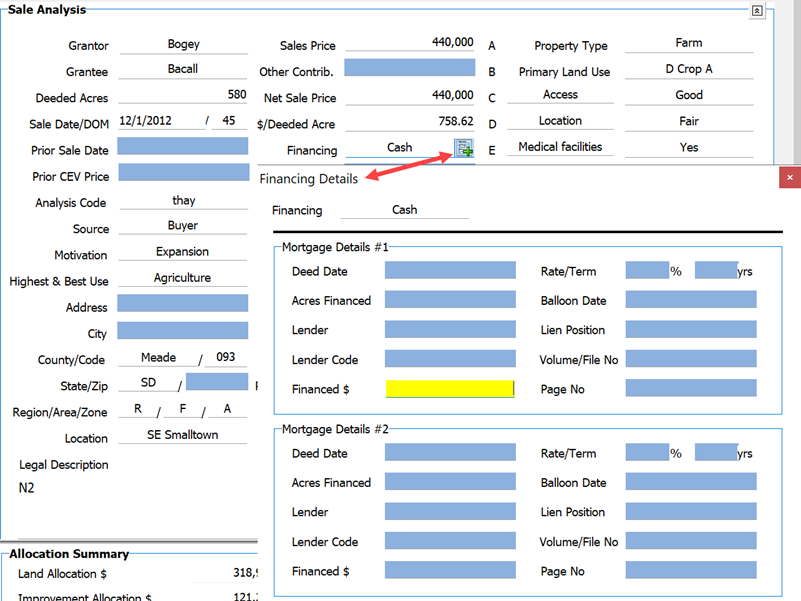
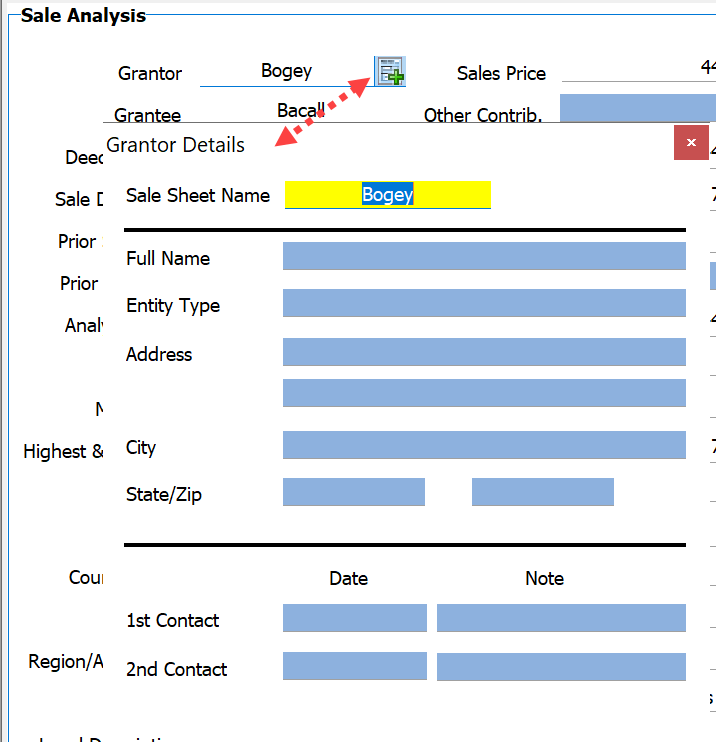
There are several fields in this section that can be expanded for additional details: Grantor, Grantee and Financing. This allows TRACKING of the details in DataLog ONLY; the information is not transferred anywhere and is NOT visible in ClickForms.
The expanded Grantor field looks like this:
Land-Mix Analysis
The Land-Mix Analysis section comes next on the sale sheet. Creating a land table here helps ensure consistency that is important to the Sale Comparison Approach in an appraisal report. It is important to use the same Land-Mix table/list for the comps AND the subject. In order to create a land table, enter up to 10 desired land uses and their corresponding ratios into the Land-Mix Analysis grid.
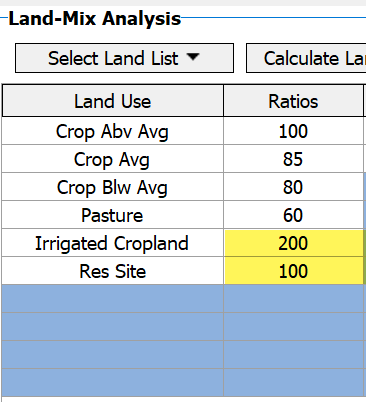
The first land row ratio is ALWAYS 100, as shown below. This example is an unimproved sale; once the Land Use, Ratios, and Acres columns are complete, the Calculate Land Values is clicked. DataLog uses the ratios for calculations.
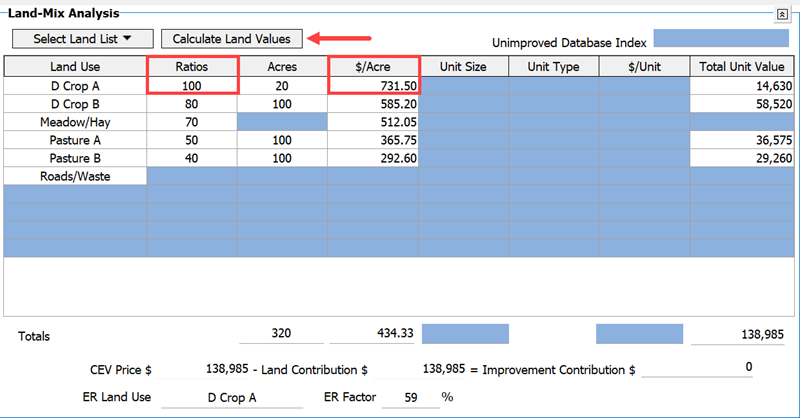
Another example shows that a land use ratio value greater than (or equal to) the first land row ratio is acceptable.
For an improved sale, the user must manually enter the $/Acre value for the first land row PRIOR to clicking the Calculate Land Values button (1). If units other than acres are to be used, the information is entered into the Unit Size, Unit Type, and $/Unit columns.
The ratios are developed by the user from data sources such as puritan sales, productivity, and rent after considerable market analysis. They represent the relative value between the land types and expressed to the nearest 1%; not rounded to the nearest 5% or 10%.
Again, the user must set the $/acre value for the first row only for an improved sale; this step is omitted with unimproved sales. The software automatically calculates the $/acre when the Calculate Land Values button is clicked.
NOTE: It is important to note that for rural residential sales that will be used in a UCRR format report in ClickFORMS, the site must be listed in the first row so that when the sale is transferred into ClickFORMS the UCRR forms will work correctly. Click Select List→Add and enter a name for the list.
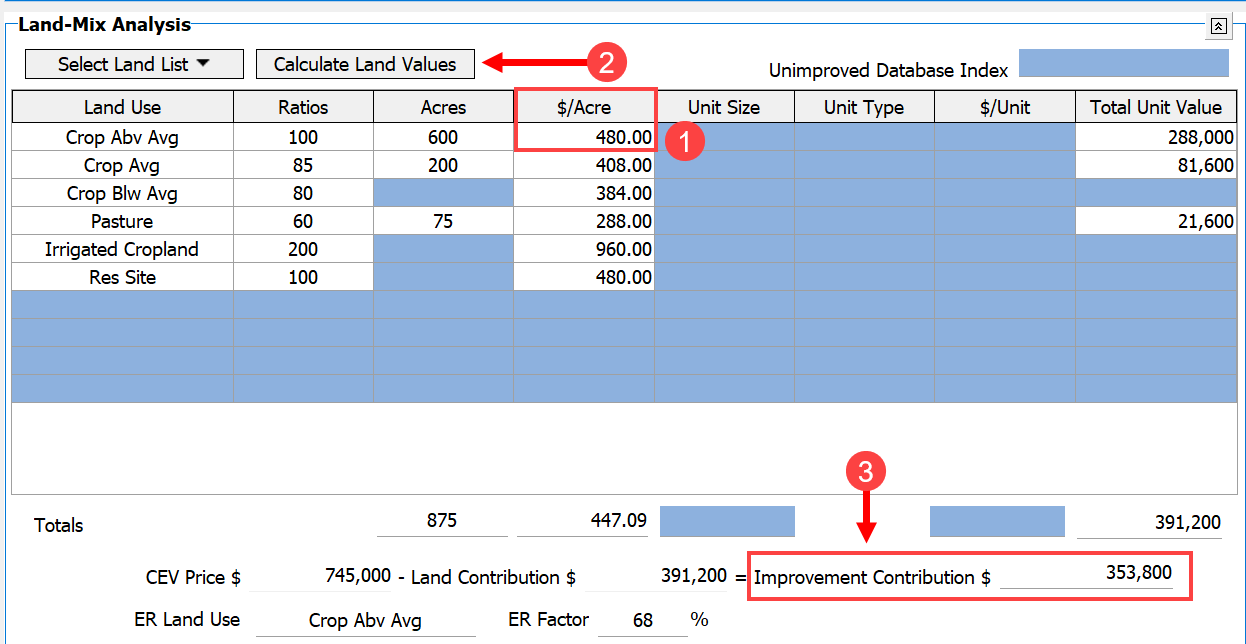
1) Enter $/Acre
2) Calculate Land Values
3) Improvement residual dollars..
Remember: Ratios, Acres, and $/Acre are for use with acres; the “Unit” columns (right portion of the land-grid) are for use with non-deeded land components that may be part of the sale.
Next, go to Step 1 for an unimproved sale; for an Remember: Ratios, Acres, and $/Acre are for use with acres; the “Unit” columns (right portion of the land-grid) are for use with non-deeded land components that may be part of the sale.
Next, go to Step 1 for an unimproved sale; for an improved sale jump to Step 2.
- UNIMPROVED SALE: Input the number of acres for each of the land types; then click Calculate Land Values. You will see that the $/Acre and Total Unit Value columns fill with data. The final $/Acre reflects the land/mix ratios for the list you used. A $/Acre value for all land types needs to be developed, even though the sale may not have all of the types of land. This is important because the subject may have land types that the sale does not. The land/mix ratios should be reviewed and adjusted periodically to match market conditions. Using land lists ensures consistent data entry—critical for the software calculations to work properly.
- IMPROVED SALE: Enter the desired $/Acre for the first land mix row (determined from unimproved sales), and usually known as the “100% line or ‘top-dollar’ row”. Next, click “Calculate Land Values”. It is important to remember the first call on sales price goes to land. DataLog forces the user to enter the land value first, and the “residual” falls to the buildings or improvements.
Income Analysis
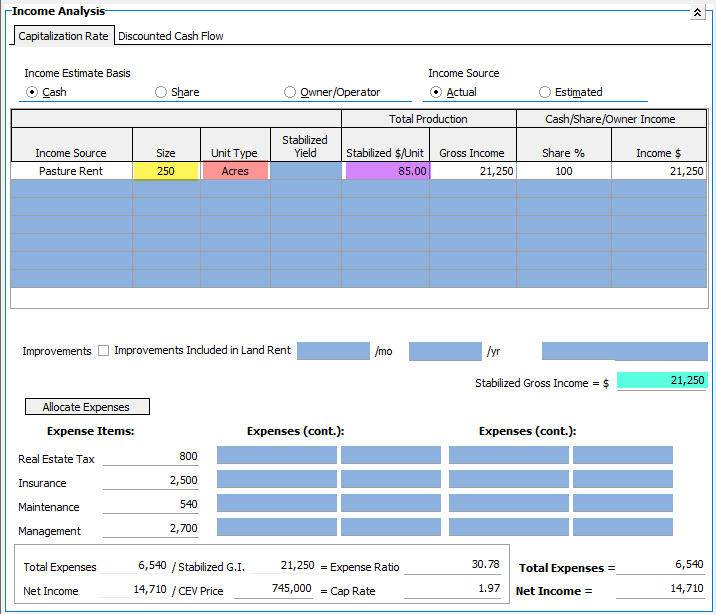
The next section is the Income Analysis. Cash rent is used in this example. Click on Cash; enter Pasture Rent as the income source, and 250 acres. The Stabilized $/Unit is set by the user to $85 and the share will be 100%. The software calculates the income as $22,250. You can list expenses like insurance, maintenance, management costs, and taxes as needed. Once the net income for each comparable sale is estimated, it will be divided by the sale price of the property to develop an overall capitalization rate for use in the income approach. When mixed properties (cropland, irrigated, pasture, etc.) exist, the user may have several “rental categories” to reflect the market activity for each component. Analysts allocating and approximating income for mixed properties should avoid rental rates from “pure” sales of only one land type, i.e., the rental rates applied should original from mixed properties where the “blend” of the mixed sale is reflective of other competitive income property(s).
The cap rate is auto calculated.
Improvement Analysis
For the Improvement Analysis section, there is room for twenty improvements per sale. If additional room is necessary, consider “grouping” two or more sales of similar construction and effective ages. Input the information about an improvement in the order listed, for as you move from cell to cell where values will calculate for effective age and remaining life. For example, enter data for a house of 2,400 sq ft with Average utility and excellent condition. With Total Life of 50 years, RCN/Unit of $45/sf, and Physical Depreciation of 20%, the software will calculate the remaining life as 40.
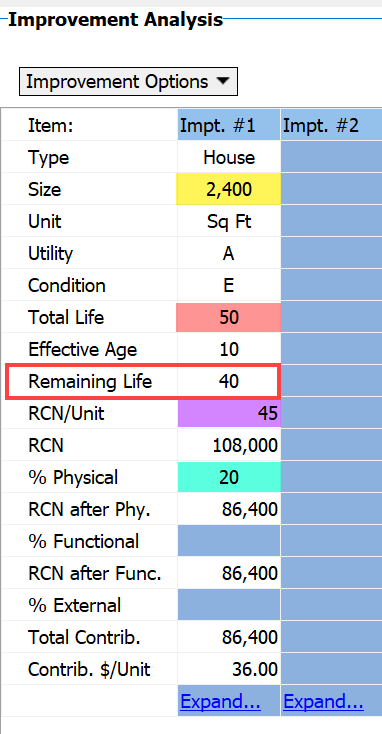
The improvement contribution is already known because it is based on the Land Mix Analysis; it is copied to the bottom of the improvement grid to allow the user to see the difference between the total entered improvement contribution and the known contributory value. Adjustments to depreciation are made until these two values match to the degree possible (usually when both values are within a few hundred (+/-) or a thousand dollars. The appraiser must decide how the depreciation is to be allocated among the improvements and to what degree the depreciation is physical, functional, or external.
More detailed information can be found in the improvement analysis video Located in this documentation.
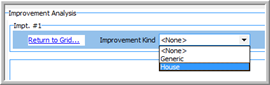
UCRR Improvements
There is a link at the bottom of each improvement that allows you to expand the details about that structure. You must choose the type: Generic or House. If you select House and enter related information, the house-specific data points will transfer into the UCRR Sales Comparison Approach page in ClickForms. In either case, these pages do transfer into any ClickForms report with the sale.
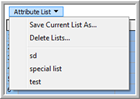
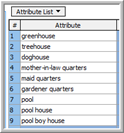
An Attribute List is created in the same manner as a Land List. When the expanded improvement page is in view, the Attribute List is empty. Enter the attributes for the improvement in the appropriate cells. To save the list for future use, click the drop-down arrow and choose Add and name the list.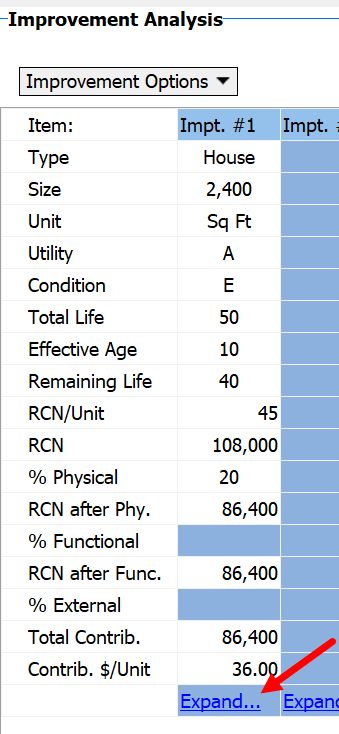
The Photo Pages allow the user to include jpeg images with the sale. Photo pages do move with a sale when it is transferred into a report.
The Comments and Attachments Sections are located at the bottom of the sale sheet. There are four tabbed pages for a variety of comments options. The first three tabs are for comments that the appraiser wants to include not only in the sale file, but on the corresponding pages in a future report. For example, comments included on the Sale Sheet tab will migrate onto the actual Sale Sheet page of a report in ClickForms when the sale is pulled into a report. Comments entered on the General tab stay with the sale. Images and other documents can be “attached” to a sale; however, these do not necessarily automatically migrate into a report.
A Final Few Words about DataLog:
Two numbers are used to identify sales in DataLog: The Database ID# and the Index #.
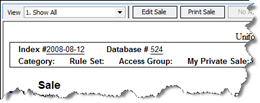
When you create a new sale and save it, the software will automatically assign a Database ID number to the sale (1, 2, 3…); seen as #524 above. These are not reliable reference numbers because they can change when sales are moved around in the database.
There is a cell for an Index Number in the upper portion of the sales grid; #2008-08-12 shown above. This is for your internal numbering system that you create based on your preferences. Many users opt for something similar to the example above, where the “08” is the county code and “12” identifies this as the twelfth sale written for the year; however, the state and county are fixed fields that can be searched. Thus, the “user defined number” may want to be based on something other than state and county. The system never changes I-numbers, so these can be used as a reference and used to call that sale into the ClickForms grids rather than the “d-numbers”.